hitstartup
Paid digital advertising
 Paid digital advertising
Transcription
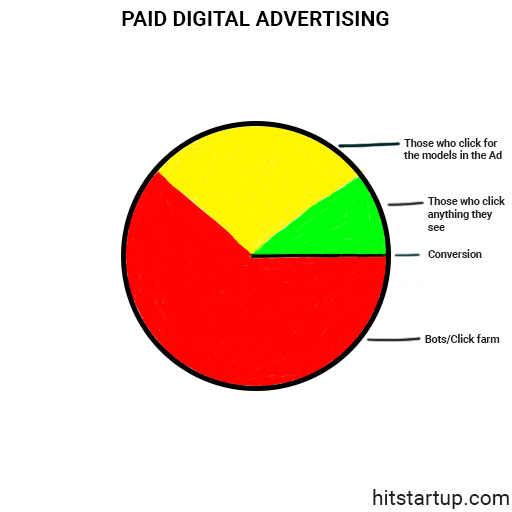
A piechart shows the distribution of clicks in a digital advertising campaign.
Predominant portion of the chart in red is marked as 'Bots/Click farm'.
Significant portion of the chart in yellow is marked as 'Those who click for the models in the Ad'.
Minor portion of the chart in green is marked as 'Those who click anything they see'.
Negligible portion of the chart in black is marked as 'Conversion'.
Newsletter
I strive to write low frequency, High quality, Actionable content on Entrepreneurship opinionated towards indies and solopreneurs. If you would like to receive them in your email inbox then please consider subscribing to my Newsletter.